Arctic and Antarctica
Reference:
Petrov, A.N. (2023). Anomalously light geological complex on the watershed plain of the Yano-Indigir lowland. Arctic and Antarctica, 2, 1–33. . https://doi.org/10.7256/2453-8922.2023.2.40424
Anomalously light geological complex on the watershed plain of the Yano-Indigir lowland
Petrov Aleksandr Nikolaevich
geophysicist
194355, Russia, St. Petersburg region, St. Petersburg, ul. Zhenya Egorova, 5, sq. 642

|
an-petroff@yandex.ru
|
|
 |
|
DOI: 10.7256/2453-8922.2023.2.40424
EDN: RIUBCY
Received:
11-04-2023
Published:
24-04-2023
Abstract:
The research method is a purposeful petrophysical interpretation of the gravitational field. The object under study appeared during prospecting geological and geophysical work as a hindrance to the solution of the main geological problem. Its density is 1 g/cm3, the height of the sole is 35 m, the area is 1420 km2, the volume is 20 km3. The object is defined as an abnormally light Ice Complex (ALIC). The revealed density is explained by peat-ice performance. In ALIC, a near-surface lenticular-layered formation ice has been uncovered, the structure of which indicates the generation of the mass of the complex ahead of sedimentation. The gravimetric data, the landscape and the details of the ALIC structure are interconnected and make up the first — the most complete view of the complex at the moment. The main elements of the presentation are the three phases of the development of the complex. The first is classical, generally accepted for polygonal—vein structures, the second differs from the classical one by the absence of frost-breaking cracking, the third is the growth of formation ice. The qualitative difference of the thermophysical components of the cryolithozone of the territory is given, which made it possible to introduce several concepts concerning the generation of peat-ice mass ALIC. Such as: heat dissipation capacity of the middle layer, stabilization of the zero isotherm at the petrophysical boundary; conditions for the beginning of the growth of lenticular-layered ice; accelerated lateral segregation growth of powerful ice veins; constancy of the thermal resistance of the cryolithozone. On the basis of these concepts, models of the development of the second and third phases of ALIC are compiled, and a view on the theory of the formation of cover glaciers is formed, which follows from the model of the third phase. The novelty of the research consists: in identifying a unique petrophysical object, in defining this object as ALIC, in identifying an ice massif on the territory of ALIC, in presenting the development of the complex as a sequence of three phases, in compiling models of the second and third phases of ALIC and in an original approach to the formation of cover glaciers.
Keywords:
gravimetry, Nettleton's method, thermophysics, climate, cryolithozone, geocryology, ice complex, formation ice, freezing, segregation ice formation
This article is automatically translated.
1 IntroductionOn the Yano-Indigirskaya coastal lowland, on the territory of its watershed plain by the forces of the geophysical detachment at the Polousnenskaya geological party of the Yanskaya/ In the years 1976-1985, under the guidance of the author of the article, a profile high-precision (at that time) gravimetric survey was carried out. The purpose of the work is to identify local negative anomalies tracing buried valleys in the relief of bedrock. The gravimetric field in the Bugey reduction was calculated. In all areas of the survey, the correlation of the calculated field with the daytime relief was manifested, which disappeared when the density of the intermediate layer was taken close to 1 g/cm3. The revealed circumstance indicated the presence of significant masses of abnormally light rocks in the relief: ice or icy peat. The influence of these masses was superimposed on the gravitational influence of the studied geological objects and distorted the results of the geological interpretation of geophysical data. In order to account for and eliminate gravitational interference created by abnormally light rocks of the relief, certain studies were conducted aimed at identifying patterns of distribution of abnormally light arrays and their geometry. Purposeful processing of gravimetric observations made it possible to identify a unique relief-forming cover made by abnormally light rocks at one of the work sites. The average capacity is 17 m, the total volume is the first tens of cubic kilometers. In order to confirm the reliability of the data that made it possible to identify an abnormally light cover, the article presents the parameters of gravimetric survey, the method of purposeful processing of observations and the results of this processing. The source of information is "Report on the results of advanced geophysical work within the Churpun-Maksunuoh series of magnetic anomalies in 1982-85" [1], then — just a Report. This document contains generalizations on previously accumulated material. Some details of the observation processing methodology that are missing in the Report are given from memory. Unfortunately, it is hardly possible to extract additional information from field and desk materials. Access to these materials is associated with the following unfavorable circumstances: in the early nineties, the Polousnenskaya hydraulic fracturing plant was liquidated; in the early two thousandth, the Polar GRE was liquidated; the Yanskaya GRE, which could inherit the assets of the Polar GRE, is currently being liquidated. There is no staff, only one liquidator works. On the territory of the above-mentioned site, the field life accompanying the main work led to the identification of a unique formation: relief-forming formation ice, with a lenticular-layered structure reflecting the process of its formation. There was no documentation. The article gives a verbal description of the results of the inspection and provides a qualitative assessment of the degree of prevalence of such formation ice. Models of their development have been developed to understand the involvement that abnormally light relief-forming cover and lenticular-layered ice take in the geocryology of the region. The first versions were formed during the period of the considered gravimetric work, the presented version is currently being developed. The logic of these models was continued in the obvious third model, which presents a scheme for the development of relief-forming ice to the volumes of the cover glacier. To confirm some of the geomorphological characteristics of the territory, fragments of the electronic, publicly available "Public Cadastral Map" of Rosreestr [2], the esri satellite images layer (hereinafter referred to as the Rosreestr map) are given. 2 Geology of the regionThe studied area is an area of stable cryolithozone, composed of Cenozoic sediments and bedrock. The Cenozoic complex is represented by loose marine and alluvial sediments of the entire spectrum of dispersion (silts, clays, sands) with layers of plant residues. Power from zero to three hundred meters, hereinafter referred to as "loose deposits". Under the loose sediments are "... rocky and semi-rock bedrock of Mesozoic age" [1, p. 50], representing a terrigenous strata of a high degree of lithification with inclusions of local diorite intrusions and dikes of quartz porphyry. The thickness of permafrost rocks reaches 400-600 m . The relief is mainly made by the so-called Ice Complex (LC), to a lesser extent by loose sediments and sometimes by bedrock. According to Yu. B. Badu [3, pp. 118-120] LC is a product of syncreogenic lithogenesis. "According to the lithological composition, the deposits are quite monotonous: horizontally layered powdery sandy loams and loams (siltstones) with traces of gluing, with layers and lenses of peat." He also indicated that: the capacity of the complex reaches 50-60 m; the iciness of the rocks of the complex is 30-80%; there are powerful polygonal-vein ice (PLL), performing up to 60-70% of the volume of the complex, with a thickness in their upper part reaching 8-10 m; the total total iciness of the ice complex reaches 70-95%. 3 Gravimetric observationsThe gravimetric survey carried out in 1976-1985 was carried out using similar methods. Gravimetric observations were carried out using a system of orthogonally arranged profiles. The distance between the profiles is 1-2 km. At the intersection of the profiles, strong points were equipped with the installation of ground reference points. The shooting step is 100 m. The accuracy of gravimetric observations on an ordinary network is 0.06 mGal. The accuracy of the altitude reference of observation points is 20 cm. If necessary, the so-called "relief correction" was introduced. The total shooting accuracy in the Bug reduction is 0.1 mGal. All the results of gravimetric surveys were used for indirect determination of the density of relief—forming rocks - by the Nettleton method. The presence of abnormally light masses was noted at all sites of gravimetric work. Fragments of the gravimetric profiles of the project suitable for Calculations (extremes and ledges) were selected by continuous viewing of the calculated gravimetric logs. Local height differences of 5 m were considered sufficient for Calculations .
The average density calculated by the Nettleton method for the areas worked out over the entire period of the survey fits into the interval 1.13–1.17 g/cm3 [1, pp. 55-57]. It should be noted that the wide step of the survey did not allow calculating the density of relief-forming rocks for relief extremes with a width of less than 300 m. During the entire period of geophysical research covered, accompanying parametric drilling was carried out, the main task of which was the point determination of the elevation marks of the bedrock surface and sampling. Rock density was measured from samples. Summary results are available in the report [1, p. 55, Table. without a number]. Sampling was not methodically targeted (and appropriately technologically equipped) to study the section in the geocryological aspect. The bulk of the samples submitted for study belong to loose sediments. These are silts, sands, clays and plant residues, a total of 518 pieces. The increased iciness was determined visually by assessing the participation of texture-forming veins in the measured samples. There were no samples of PPL. Only 19 samples of the soil-vegetation layer with an average density of 1.25 g/cm3 fall into the category of abnormally light rocks from the measured rocks. The average density of loose sediments throughout the territory of geophysical work, according to the Report [1, p. 55], is 1.77 g/cm3. In general, it can be stated that parametric drilling solved the issues of the structure and petrophysics of loose sediments and, practically, did not bring any clarity to the question of the presence of abnormally light formations in the studied territory. Particularly massively reduced relief densities were identified within the framework of the project to study the Churpun-Maksunuoh series of magnetic anomalies [1] at the Khabdy-Stan site. The total volume of gravimetric survey for this project is 982 km. According to the uch. Habdy-Stan, the volume of the survey is 418 km, its area is 195 km2. The stream that gave the name to the site is written "Habdzhi-Stan" on the Rosrestra map. The site is located in the southeastern vicinity of the Maksunuoha-Tas mountain range between the Danilkina and Maksunuoha rivers. The relief of this site as a whole is slightly elevated, the absolute surface marks are in the range of 20-70 m, dissected by the valleys of streams and basins of alas, convenient for density calculations using the Nettleton method (hereinafter — just Calculation). The calculation results available for the Habdy-Stan site are correlated with the average elevation marks of the calculated relief forms. Pairs of correlated parameters are entered in the variation table with grouping by density in the range of 0.1 g/cm3, and by height in the range of 5 m (in the Report, the height interval of grouping is indicated with an error). Additionally, it was taken into account that the larger the vertical size of the calculated relief shape, the more weighty the calculation result. When constructing the variation table, the weight of the calculation result was taken into account by creating a separate "weight" density value for each altitude grouping interval covered by the Calculation. It is shown below that the masses covered by one Calculation can form relief forms up to twenty-five meters high, i.e. occupy from 1 to 5 height intervals. The resulting variation table is transformed into a variation field of lines of equal frequencies of occurrence of densities of relief-forming rocks, which is shown in Fig. 1. The height parameter of the Calculation when constructing the field was set in the center of the height interval of grouping. Other sections of the project have a more even relief: "In the remaining sections, the height differences are too small to construct such diagrams" [1, p. 55]. A total of 176 Calculations were made on the project [1, p. 55]. Separately, the number of Calculations for the Habdy-Stan account is not specified, but given the smooth relief of other sites, it is safe to assume this number is more than a hundred. The number of individual "weight" density values can be reconstructed from the variation field. It does not reach nearly five hundred. There was no transfer of Settlement positions to the reporting plans. Before analyzing the statistics of the calculation results, we will touch on the advantages and disadvantages of the Nettleton method. The advantage is that it is used to determine the density of a large volume of rocks in a natural setting, i.e. not deformed, not lost moisture and, in our case, with actual iciness and with inclusions of vein ice. The application of this method is similar to taking and studying a representative sample. 
Figure 1. Borrowed from the Report [1, p. 56, fig. 3]. The caption to the drawing has been corrected by the author. The disadvantages of the Calculations are the limited scope of the study by the high-altitude "base" of the relief and the mandatory absence of commensurate gravitational anomalies caused by third-party objects. In the territory under consideration, gravitational anomalies are created by: the buried relief of bedrock (the density difference at this boundary was assumed to be 0.95 g/cm3) [1, p. 94], crystalline massifs contained by the thickness of bedrock, and the buried relief of loose sediments. Only the anomalies of the field caused by the buried relief of loose sediments close to the surface (the density difference at this boundary is 0.75 g/cm3) can be commensurate with the anomalies of the gravitational field taken for Calculations.
The distribution of the calculation results shown in the diagram of the densities of relief-forming rocks (Fig. 1) clearly reflects the fact of the presence of a horizontal density boundary. The Report summarizes that the presented diagram "... convincingly shows the presence of two complexes of relief-forming rocks. The border between them runs along the 35 m mark . Almost pure ice lies above it, and below it are loose sediments with an average density of 1.76 g/ cm3" [1, p. 55]. The position of the specified boundary is a statistical parameter, the actual position of which can change, forming a buried relief. Let's turn to the region of the variation field corresponding to an abnormally light complex of rocks (Fig. 1, bottom right). The distribution of the calculation results along the density axis in this area by external signs can be assumed normal (with some asymmetry). Then (by digitizing the variation field) we get the value of the standard standard deviation of the density (standard error) in ~ 0.25 g / cm3, and the confidence interval within this deviation is 0.75–1.25 g/cm3. The average value for the region is 1.01 g/cm3, the mode is 0.95 g/cm3. In the range of heights from 60 to 70 meters, one can see a separate, not very pronounced dependence of the density of rocks on height. The average capacity of the complex of light rocks is 17 m. The theoretical accuracy of the Calculations according to the Habdy-Stan method with the accuracy of observations achieved on an ordinary network and with the average amplitude of the measured abnormally light relief forms ~17 m is ~0.11 g/cm3 (calculated by the full differential of the Buge reduction formula). Thus, the standard deviation of the actual distribution in the diagram is twice as high as expected. The reason for the increased dispersion of the densities of the considered region of the variation field may be the gravitational influence of the buried relief of loose sediments. For the zone of increased density values, the buried relief is obviously directly correlated with the daytime relief. For the region of "unrealistically low values" (below a density of 0.9 g/cm3), an inverse correlation is likely. The area of the variation field corresponding to the daytime relief of loose sediments (Fig. 1, top left) includes 15% of the Calculations. The maximum number of Calculations is in the grouping interval 30-35 m. The spread of densities of this region of the variational field does not cause any questions. It corresponds to the average taken according to the standard deviations of the densities of the rocks in the above-mentioned table on tcheta [1, p. 55, Table. without a number]. The coincidence of the average calculated density of loose sediments, equal to 1.77 g/cm3, with that detected from the samples, indicates the absence of a systematic error in the Calculations. All Calculations were performed according to the same methodology. Therefore, the calculated average density of an abnormally light complex, which is not provided with objective control, can also be considered free from systematic error. Figure 2 shows the terrain characteristic of the Habdy-Stan uch. in comparison with gravity graphs calculated using different parameters of the Buge reduction. A 3 km long section is shown, on which, judging by the relief, at least 5 Calculations were made. It can be seen that the relief-forming masses affecting the calculation results represent the entire thickness of the abnormally light complex, cover up to 25 and even more meters vertically in separate forms. On the basis of which it can be concluded that the derived statistical density of this complex is not a reflection of the density of individual near-surface irregularities, but is a characteristic of its entire volume. The accuracy of the initial gravimetric data, the suitability of the relief for density calculations using the Nettleton method, a significant number of calculations, the confirmed absence of a systematic error in the Calculations and the full coverage of the power of the abnormally light complex indicate the reliability of the estimates of its density. Having a statistically justified lower limit of abnormally light rocks, we can, guided by the terrain, in principle, indicate their horizontal distribution. This by and large solves the problem of excluding the influence of light masses on the results of geological interpretation of gravimetric data. In geocryology, the relief-forming abnormally light complex of rocks isolated by means of gravimetry can be considered as a variant of LC, we will designate it as an "abnormally light ice complex" (ALC). If we take the density of frozen plant residues present in the ALC to be close to the density of ice, and the density of the mineral component to be 2.5 g / cm3, then the proportion of the latter in the ALC is ~ 7%. Accordingly, 93% of ALLCS are ice and peat. 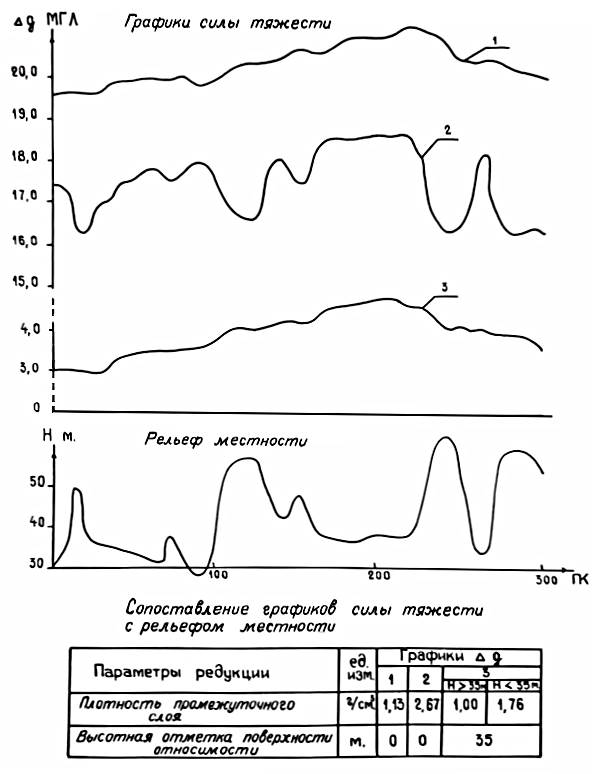
Figure 2. Correlation of gravity graphs with relief. Uch. Habdy-Stan, PR 40, PK 0-300 (31 observation points, 4 reference points, 3 km profile). Borrowed from Report a [1, p. 94, fig. 4]. Corrected: the empty zones between the charts and the title have been removed. ALLK is not limited to the territory of the uch. Habdy-Stan. On the Rosrestra map (see Fig. 3), this territory is characterized by three signs: · the presence of embedded streams without wandering meanders, · a significant proportion (about 50%) of hilly tundra,
· ubiquitous presence of local alas. 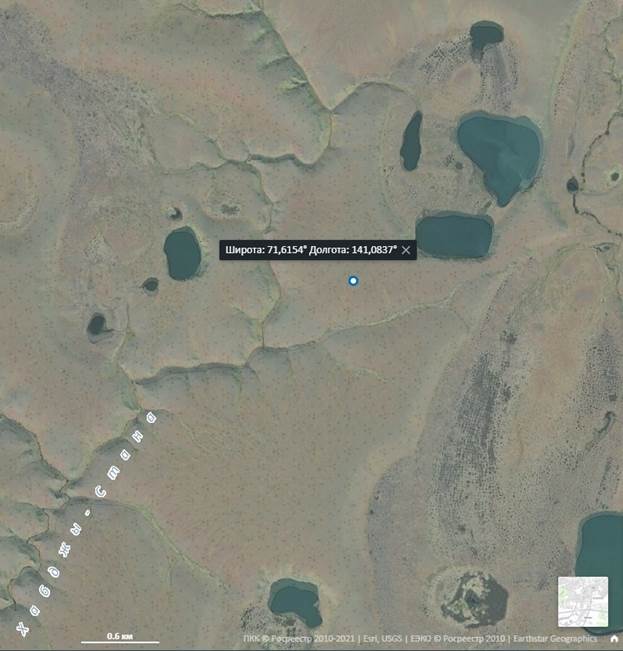
Figure 3. Typical landscape of ALLK. Rosrestra map [2]. Direct access to the esri satellite image: https://bestmaps.ru/map/esri/sat/11/71.6154/141.0837These signs can be traced throughout the Danilkin-Maksunuoha interfluve, starting from the Maksunuoha-Tas mountains and ending 40 km from them. Adjacent to this square is a small apophysis, skirting the mountains from the south. The contour of the ALLK constructed according to these features is shown in Fig. 4, it covers an area of 1,420 km2. With an average power of 17 m and approximately eighty-five percent coverage of the territory, its volume is equal to ~ 20 km3. In the immediate vicinity, the presence of a landscape with similar features can be noted to the south of the Danilkin River: there are embedded streams, but not much; there are alas, but they are mostly combined into alas valleys; hilly tundra — a series of parallel uvalas. You can also specify the territory adjacent to the Haar-Stan mountains from the east, its difference is in the Alas — there are much fewer of them here. 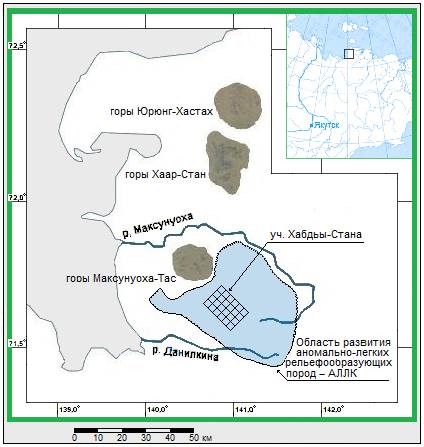
Figure 4. The area of development of ALC. 4 Results of ground-based observations accompanying geophysical work and economic activityDuring the installation of the ground reference points , the excavation was carried out to a depth of 1 m . Everywhere at a depth of 40-60 cm, fossil ice was uncovered. The facts of the autopsy were not documented, no attention was paid to the structure of the opened ice. The estimated share of installation recesses that have opened the ice is 50%. The removed soil is a dense, viscous dark brown to black mass without noticeable mineral inclusions (has not been studied closely). Most likely, it would not be a mistake to call this mass peat soil. In the absence of ice, the peat soil was traced to the bottom of the mine. For the most part, the low-lying territories of the Habdy-Stan uch have polygonal microrelief of varying degrees of waterlogging. The elevated forms of the landscape can be divided into hills and horizontal/slightly inclined plateaus. All hills are characterized by the presence of a non-polygonal hummocky microrelief. On the plateau there are: non-polygonal hummocky and non-watered polygonal microreliefs, each of them can extend for hundreds of meters. The non-polygonal hummocky microrelief in the whole territory has the following parameters: a hummock of evenly sporadic distribution, 20-40 cm high, up to 40 cm in diameter, the distance between the hummocks is 0.5–1.5 m. On all areas of such a microrelief, ground observations have established the absence of signs of frost-breaking cracking: no grooves, no rollers. Figure 5 shows a fragment of the Rosrestra map on a hummocky raised slightly inclined territory in the maximum readable magnification. The inherent spotting of this surface was not noticed during ground observations. Its connection with the structure of the frozen massif is not discussed in this article. 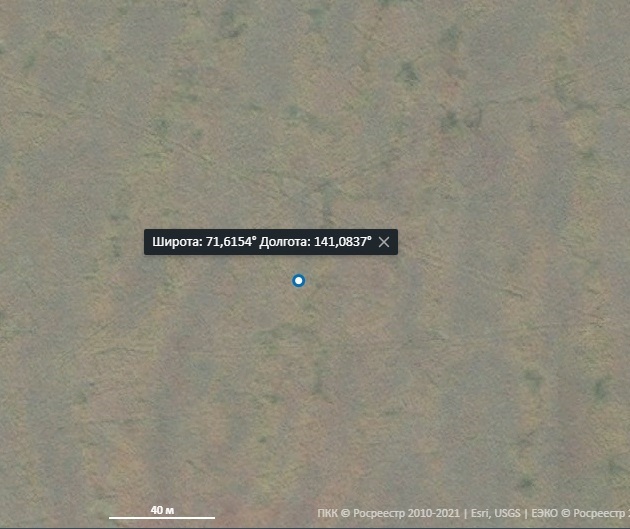
Figure 5. Non-polygonal hummocky microrelief on an elevated slightly inclined territory. Rosrestra map [2]. Direct access to the esri satellite image: https://bestmaps.ru/map/esri/sat/17/71.6154/141.0837The areas of non-polygonal microrelief, as can be seen from Fig. 3, cover a significant part of the studied territory. If we consider the entire ALLK (follow the link included in the caption to Fig. 3 or 5), then this part can be estimated at approximately 30-40%. A hundred meters from the base of the detachment, there were three small elongated hills with a hummocky surface, of one stretch (hereinafter referred to as microvalls). The shape of these microvalls is steadily convex without flaws, smoothly articulating with the bearing territory. Clearly not Baijarahi. In the absence of exact coordinates of the detachment's base, we will indicate that it was located in the upper reaches of the Khabdy-Stan creek no further than two or three kilometers from the center of the work area (uch. Khabdy–Stan). With a "visual picture" clearly preserved in memory, 2-3 points on the Rosrestra map seem suitable. During the construction of the cellar, one micro-shaft with a height of ~ 5 m, a width of ~ 10 m, a length of ~ 20 m was opened and solid lenticular-layered ice was found inside it. The ice started from a depth of 50 cm, but when the shaft was deepened to 1 m, a plank thermal protection was built into it. Therefore, the ice contact zone with the soil layer turned out to be out of sight. The description of the detected ice is given in section 5.1. Similar in appearance and, presumably, with the same filling, micro-vents (hereinafter referred to as "ice") were subsequently repeatedly visually noted throughout the work site. They were noticed to be confined to the periphery of the plateau. On the Rosrestra map, it is not possible to confidently identify ice micro-rocks on the territory of the ALC, since with the available resolution it is difficult to assert that the micro-rocks observed on the map are steadily convex, without "flaws".
The catches of streams on the territory of the ALLK have the shape of a wedge. One was examined in detail when pulling out an all-terrain vehicle. The car completely went under the water, leaning on the bottom with its tailboard. The depth is about 7 m, the lateral faces of the wedge are inclined ~ 70 ° to the horizon. It is assumed that the catch is pulled out ice wedges. The large depth of seasonal thawing is obviously related to the effect of running water. The emptiness of the catches can be explained by the absence of mineral suspensions in the water of the stream. The catch is separated by bridges — grassy rifts, without traces of gravel or sand, even on a badly broken all-terrain track. On one of the remote bases of the detachment, located near the lake Yuryung-Uulakh (on the eastern outskirts of the territory of the ALLK), a cellar was also arranged on the latitudinal stretch extending from the lake on the territory of a non-polygonal hummocky microrelief. In the first depression, the peat soil went below 50 cm, and it was abandoned, the second opened an ice wedge. Both points were chosen randomly in the complete absence of "search signs" and showed, in principle, the same as the above 50% occurrence of ice. The ice contact zone with the soil layer was not examined. Wedge dimensions: width at the top (at a depth of 1 m) is ~ 3 m, and at a depth of 4 meters: ~ 1 m. The shape of a simple wedge with a large angle of convergence of the faces. The ice is clean, similar to lake ice. Layering and inclusions were not noticed. When entering the enclosing rocks on the sides of the wedge, neither sampling nor even visual examination was carried out. There were no natural outcrops of wedges or ice layers on the shooting area. In August, one day there was a surviving snowfield covered with a dense layer of dust. It looked like a sandy-clay spit, without vegetation. The thickness of the dust layer is estimated to be about a millimeter (not measured). The location of the spit in the relief made it possible to consider it a zone of unloading of western wind flows. 5 Development models of identified objectsThe models of development of the discovered objects proposed for consideration are constructed for the flat conditions of a stable subarctic climate with a short climatic summer based on: qualitative assessments of the characteristics of the thermophysical components of the cryolithozone, the principle of thermal interaction between them, the influence of the external environment. Let's denote these models as conceptual. A significant place in the models being built is occupied by the processes of segregation ice release. It is taken into account that ice release is subordinated to freezing. And also the fact that the front of the control freezing is advancing due to the build-up of ice, which leads to the formation of a new geological body. On the issue of the main causes of segregation ice release, we will follow the conclusion of V. I. Solomatin, who, summarizing the results of previous studies, in his work [4, p. 113] states: "The primary determining force that ensures the occurrence of the thermodynamic potential gradient of unfrozen water leads to a violation of thermodynamic equilibrium in the freezing system and ultimately causes moisture transfer from the melting part of it and the ice release in the freezing part is the temperature gradient" It is also indicated that the presence of "ice crystals" in the freezing front area intensifies the flow of water. Yu. K. Vasilchuk, in his analysis of the factors influencing the possibility of segregational ice release, points to their multiplicity and diversity. Assessing the uncertainty arising in this regard, he comes to the conclusion that the decisive factor of ice formation can be attributed to "... it is the regime of the freezing process itself" [5, p. 312]. "Freezing mode" is a complex concept-a container. In the context of the topic of ice release, the "freezing mode" is convenient because it can be correlated with the complex property "ice-releasing" /"non-ice-releasing". The cryolithozone in the territory under consideration consists of three thermophysical layers. The upper layer is seasonally thawed or active (hereinafter referred to as STS), thaws and freezes during the change of seasons. Made with peat. Judging by the depth of the exposed ice (see sec. 4) its capacity is ~0.5 m. STS is important in the issue of providing segregational ice release with water. In the conditions under consideration, it is characterized by increased water content, especially in its lower part, and its own experience has been confirmed. A quantitative assessment of humidity for the territory under consideration was given by D. G. Shmelev: "Humidity peaks occur on the near-surface horizons and the sole of the active layer, where the weight humidity is at least 30%" [6, p. 47]. Under the STS is the "middle layer", which is characterized by seasonal temperature fluctuations, but without reaching the region of positive values. Loose sediments and/or peat and ALC ice are involved in this layer. The depth of the sole of the layer of seasonal temperature fluctuations, as shown in the collective monograph edited by S. M. Semenov in its part devoted to continental permafrost, in different areas of the cryolithozone is 10-20 m [7, p. 303]. Under the middle layer is the "lower layer" of the cryolithozone. Without seasonal temperature fluctuations. It is composed mainly of bedrock and rocks of a layer of loose sediments. In the region under consideration, the lower layer is more than an order of magnitude more powerful than the average. When constructing models, seasonal thermophysical changes are mainly considered, i.e. those that affect the STS and the middle layer. Since the thermophysical parameters of the rocks were not determined on the territory of the work, we will set them indirectly by comparing them with the table of characteristic thermal properties of cryolithozone rocks presented in the monograph by E. D. Ershov et al. [8, p. 119, Table 4.3] (hereinafter referred to as the table by E. D. Ershov). The parameters of the section components determined by this table are collected in Table 1. Table 1 — Thermal properties of the components that make up the zone of seasonal thermal changes | Cut Components |
Thermal conductivity W/(m·K) Average / Spread | Volumetric heat capacity kJ/(m3·K) Average / Spread | Thermophysical layer, a geological body | | Peat is dry | 0,07 / 0,012–0,14 | 125 / 100–150 | STS, layer | | Thawed peat | 0,8 / 0,7–0,9 | 3000 / 2400–3600 | STS, layer | | Frozen peat | 1,15 / 1,1–1,2 | 2150 / 1600–2700 | (STS, layer) and (middle layer, soil blocks) | | Ice | 2,28 / 2,22–2,35 | 1930 / – |
Middle layer, (vertical vein or formation ice) | | Frozen friable thickness* | 1,63 / 1,2–3,0 | 1770 / 200–2700 | Middle layer, layer | | Loose sands | 2,25 / 1,5–3,0 | 1950/1700–2200 | Middle layer, layer | * The parameters of the frozen friable strata are calculated as one final value based on the generalized fractional lithological composition of the strata by comparing the rocks composing it with the same table by E. D. Ershov. The spread is indicated by the limits of the values of the thermophysically extreme lithological components. Note that the applied method for determining the properties of dry peat and loose strata can only give approximate average results with a large spread of values inherited from the original table. In the list of changes/ratios of component properties presented below and used further in the text, the emphasis is on the quality of differences: 1. Dehumidification/watering of peat radically changes its thermal conductivity. 2. Freezing/defrosting of moisture-saturated peat changes its thermal conductivity (by a third). 3. In relation to the thermal conductivity of peat (especially thawed), the thermal conductivity of ice and frozen loose strata are elevated. 4. The participation of ice in a frozen section increases its thermal conductivity, and to the greatest extent if the host rocks are frozen peat. 5. Frozen sands at the exit under the STS constitute the same thermophysical situation that the presence of subsurface formation ice creates. 6. The difference in the volumetric heat capacity of ice from those of frozen friable strata and frozen peat is not significant. Preliminary characteristics of thermal physics of layers: · STS. Summer changes in the humidity of peat STS change the amount of heat reaching its sole. The seasonal variability of the thermal conductivity of this STS contributes to: in winter, the removal of underground heat outside, in summer, the protection of the frozen strata. The summer thermal protection function of the STS is most effective on elevated surfaces, where it is enhanced by partial drainage of peat.
· Middle layer. The main physical function of the middle layer in the warm season in the subarctic climate is heat removal, it cools the overlying STS. This function is active until the autumn freezing. This thesis is confirmed by the well-known phenomenon of autumn freezing of the STS from below. According to A.V. Boytsov's generalization, this phenomenon is the more pronounced the lower the temperature of rocks: "The lower the average annual temperature of rocks, the greater part of the seasonal thawing layer freezes from below" [9, p. 57]. If we sum up the thermophysical basis for this statement, we get the following: the harsh climate with its intense freezing of rocks and economical consumption of the heat-trapping potential of the middle layer in summer ensure the operability of the heat-trapping function of this layer by the time of seasonal cooling of the area. · Bottom layer. Does not participate in seasonal heat exchange. The components of the middle layer or their parts (such as the lower sectors of vertical ice veins) that pass into the lower layer during cryolithogenesis fall out of the heat exchange zone. The main parameters of the process of heat removal by the middle layer in the summer period: heat flux density (intensity) and stability. Let's combine them into one qualitative parameter: summer heat dissipation capacity. Further in the text, this ability is assigned qualitative values: "sufficient" if it is sufficient to support segregation ice formation and ensures the safety of newly formed ice until winter, or "not sufficient" if it does not perform at least one of the above tasks. In stable (from season to season) external thermophysical circumstances and with the constant thermophysics of peat STS, its potential for summer heat accumulation has a significant impact on the quality of the summer heat dissipation capacity of the middle layer. Theoretically, this potential depends on the volumetric heat capacity of the layer material, its size (power) and the degree of winter cooling (spring temperature). According to the absence of a significant difference in the volumetric heat capacities of the components of the middle layer noted above, its heat accumulation potential practically does not depend on the composition of the layer. The other two parameters depend on the thermal conductivity of the middle layer, which in turn depends on the share of ice, and most significantly if this participation forms a system of heat pipelines (vertical veins) parallel to the heat flow. This system of heat pipelines cools the entire middle layer in winter by means of horizontal heat exchange and causes local deflections in the surface of the lower layer. The effective thermal conductivity of the middle layer, increased by the presence of heat pipelines, contributes to an increase in its power and degree of cooling, i.e. both the dimensional and temperature components of its heat accumulation potential are growing. For powerful vertical cores of the middle layer, we will imply the presence of a separate summer heat dissipation capacity. 5.1 Development of near-surface formation iceAlong the lenticular-layered ice opened in the micro-channel, 3.5 m was passed deep. No outlet to the host rocks was recorded on the sides of the workings. One vertical wall was cleaned, the dimensions of the stripping were: vertically ~ 1.5 m and horizontally ~ 2 m. The ice is composed of horizontal lenticular elements with dimensions: horizontally 40-60 cm, vertically in the central parts 1-10 mm. Lenses can be characterized as double-convex, but this characteristic mainly, of course, refers to those lenses that have a noticeable thickening in the center. The boundaries of the lenses are visible as threads of clarified ice, sometimes traced by the remnants of the soil. All borders are of the same quality, without a noticeable hierarchy. There are no strictly horizontal surfaces. Joints of horizontally adjacent lenses were observed, we can talk about chains of lenses performing one level. Thinning/gaps at the joints are compensated by the lenses of adjacent layers. The revealed ice structure was understood as a reflection of the process of its growth. The ice outlet area under the STS remained unvisited. Against the background of the field of double-convex lenses, two zones of curved lenses spaced by ~1.3 m diagonally were marked. In the detected zones, the lenses are conformally bent upwards by 2-4 cm, united by a single vertical axis of extremes. The height of each zone is about half a meter (~ 15 layers). At the top and bottom of the zone, the curvature of the lenses gradually disappears. The horizontal size of the curved lenses does not differ from the total in terms of stripping, the total area of the detected zones, respectively, is no more than 20% of the stripping area. Rare (no more than 1-2% of the total volume) haphazardly distributed individual inclusions of peat soil residues, comparable in shape and size to ice lenses, were observed throughout the sweep. The horizontal layering that attracted attention as the main characteristic of the exposed ice and the lack of access to the host rocks determined the attribution of the identified ice massif to the layers. In this section, we will mainly consider the development of the ice layer, reflected in the described ice structure. A single element of the formation, the ice lens, will be considered the result of continuous segregation of ice, begun and completed within the framework of a single freezing. The thermophysically active layer, within which the lenticular-layered ice is formed, in the summer-autumn period consists of: the daytime surface, as a heating element, thawed peat STS, as a heat shield and moisture carrier, and the middle layer of the cryolithozone, as a thermal, summer heat-removing capacity. Assume that the ice layer under the STS is already present. If this layer does not occupy the entire middle layer, then the underlying frozen loose layer is connected to the heat dissipation. A temperature gradient is constantly maintained between the effective center of the thermal capacity and the daytime surface, the largest value of which falls on the least heat—conducting layer - STS.
During the summer-autumn period, the presence of moisture and temperature gradient in the STS, as well as the constant readiness of the middle layer to begin the freezing process from below, support the possibility of segregation ice release. Soil lenses distributed over the ice massif, due to their small number, do not have a significant effect on the thermal physics of the section. They are the end result of sedimentation and are formed when ice veins appear in the STS, transferring the lower edge of the soil into a permafrost middle layer. The formation of soil lenses is explained below. Let's consider the issues of continuity, layering and lenticular structure of the exposed ice mass. Continuity. The continuity of the examined formation lenticular-layered ice indicates the binding of the start of the next segregation ice release to the surface of the previously formed ice formation. Accordingly, the zero isothermal surface of the temperature field (hereinafter referred to as the zero isotherm) at the time of the starts should be on the ice surface, not higher. Partial thawing of ice is likely, but it did not significantly affect the overall progress of ice formation, as can be deduced from the described lenticular-layered structure. In the section under consideration, the spring process of defrosting of the STS is accompanied by two thermophysical effects: 1 — a heat shield is formed, which constantly reduces the heating of the defrosting front; 2 — the retreating frozen layer gradually gets rid of peat (with their reduced thermal conductivity), which simplifies the removal of heat from the zero isotherm. By the time the defrost front reaches the sole of the STS, the formed heat shield reaches the maximum of its capabilities, and there is no shielding layer — peat between the summer heat that pulls into itself (into its sufficiently large thermal capacity) and the zero isotherm. The little heat that reaches the sole of the STS is transported inside the middle layer. Here the thermal conductivity of the middle layer is of significant importance. The increased thermal conductivity, we can say, "thermophysically consolidates" the thermal capacity, as a result of which the heat that has reached its surface is not spent on increasing the temperature or melting ice, but is diverted deeper. Taken together, the heat shield, the thermal capacity and the thermal conductivity of the thermal capacity are designated as a mechanism for stabilizing the zero isotherm at the petrophysical boundary. All three components of the designated mechanism are fundamentally essential for its functioning. The combination of peat in the heat shield and ice in the heat tank is the most effective "stabilization mechanism" in the study area. Additionally, we point out that the formation ice continuing to form will increase the thermal capacity of the middle layer and its average thermal conductivity, thus increasing the effectiveness of the "stabilization mechanism" until the ice sole sinks into the "lower layer" of the cryolithozone. The increased efficiency of the "stabilization mechanism" in relation to the initial (minimum necessary) gives the process of formation ice generation a certain stability against the background of possible climatic variations. The introduced concept of "stabilization mechanism" allows us to attribute to it: 1 — the absence of peat in the ice; 2 — the preservation of traces of previous ice generations; 3 — the binding of the start position of the next freezing to the current surface of the ice formation. Layering. The stratification of the formation ice indicates the episodicity of segregation ice releases that cause its growth. The fact of the same quality of the boundaries between the layers, in their almost unlimited sequence, can be explained by the fact that they are all of the same kind, obviously, are the start of independent freezing. Summer episodic freezing on the surface of the middle layer at a constant, as indicated above, activity of its heat-trapping function is possible with a weakening of the heating of the daytime surface or with a decrease in the thermal conductivity of the STS. As an indirect proof of the effectiveness of the second of these reasons, we present the result of long-term observations on hummocky surfaces. Attempts to travel on an all-terrain vehicle have established that in dry sunny (around the clock) weather, this surface does not thaw until July. The moment of thawing, as a rule, could be linked with the fall of heavy rain. The observed permafrost stability is quite explicable by the high thermal resistance of dry peaty soil. Developing this explanation, it can be assumed that the drying of the upper layer of the STS during the defrost period will reduce the thermal support of the lower part of the STS, which will cause short-term weather freezing. With full defrost, this freezing will begin from the sole of the STS. Weather freezing is possible with a sufficiently weak damping of heat waves by the soil of the STS. The absence of direct studies of this phenomenon in the considered thermophysical section forces us to treat weather freezing as assumed. Further in the text, the regularity of the repetition of ice-releasing freezing, leaving for the future confirmation of the effectiveness of weather causes, we will mean periodic annual. Lenticular structure. The lenticular structure of the ice massif indicates the separation of the ice formation zones that existed at the same time on its surface. Let's give this the following explanation. The ice relief of the field of double-convex lenses formed by the time of the next freezing can affect the distribution of unfrozen water, the advance / lag of individual sections of the freezing front and the deviation of the direction of thermodynamic moisture transfer from the vertical. In this regard, a single freezing process may have different "freezing modes" in different parts of the field under consideration. Judging by the revealed features of the formation ice, these regimes are ice-producing in local depressions of its current microrelief.
To explain the identified zones of conformally curved lenses, let us turn to thermometry data. Those on the tundra zone in the torn-off soil are available in the work of S. P. Davydov et al. [10]. They represent the results of measurements carried out at a level 20 cm away from the surface on average. It is shown that the average annual temperature under the maxima of the microrelief is 3.2–3.3°C lower than under the minima. Accordingly, in such conditions, the undulation of the zero isotherm is quite likely on the sole of the thawed STS (in the territory we are considering it is ~ 50 cm). For a near-surface ice massif, this will be a wavy microrelief of ice, and the zones under consideration, based on this, can be considered thermal shadows of hummocks imprinted in the ice. The extremity of the zones of curved lenses vertically remains unexplained. It can be assumed that this is either a consequence of the inclination of the axis of extremes (oblique section), or the limited life cycle of bumps in time. The noted moments of ice formation generation, resulting from the features of its structure, can be summarized as follows: this massif was formed due to segregational ice release, which was periodically resumed from the sole of the STS in the zones of ice-releasing freezing. Soil lenses distributed over the ice massif are formed during subhorizontal separation of the soil from the STS in places where, at the time of generation of the next layer of ice lenses, the zero isotherm does not touch the ice surface. Let us outline the expected dynamics of changes in the thermal resistance of the STS, taken at the moments of generation of ice lenses, in a stable climate. For decades, the thermal resistance of the STS has been increasing, corresponding to the gradual accumulation of surface soil. This increase increases the relative heat dissipation capacity of the middle layer, but an increase in the latter during the specified period does not lead to soil separation — it is leveled by the mechanism of stabilization of the zero isotherm on the sole of the STS. After the possibilities of the "stabilization mechanism" run out, there is an abrupt shift of the position of the zero isotherm up into the body of the STS. A new vein of ice formed there creates a new petrophysical boundary on the new sole of the STS. The gradual growth of the STS summer resistance is interrupted by its immediate decrease. Abrupt interruptions of growth can be understood as automatic adjustments of the thermal resistance of the STS, keeping it within the limits set by thermophysical circumstances and, first of all, by the climate, of a "fixed" value. If the material accumulated on the surface has the same thermal conductivity, then a fixed value of the summer thermal resistance of the STS will mean a fixed power of the STS. Therefore, the proportion of soil lenses that have retreated into the ice mass can be taken as an indicator of the relative growth rate of soil and ice. Judging by the exposed formation ice, the rate of soil growth is 50-100 times less than the rate of ice growth and is (with the accepted annual frequency of ice growth) hundredths to tenths of mm/year. The separation of soil lenses from the STS is also possible when the climate cools down or just in a cold year, but in this case the horizontal conjugacy of soil lenses should manifest itself. If we touch upon the moment of the beginning of the growth of lenticular-layered ice, then this beginning seems to be the most logical on the frontal surfaces of powerful ice veins, on which an increased summer heat dissipation capacity is natural, and there is also a ready solid crystallization front. Loose rocks, in general, are less favorable as a base for starting the generation of lenticular-layered ice. These rocks, with the exception of frozen sand (see Table. 1), physically cannot create such a heat-intensive and thermophysically consolidated volume as ice creates. Therefore, on the surface of a loose layer, if we take it as a whole, the work of the "stabilization mechanism" will be less effective. This circumstance reduces the probability of the development of lenticular-layered ice from the surface of the loose thickness, but does not exclude it. Separately, we point out that the start of formation ice growth from the position under consideration is limited by a narrow time window of possibilities. Unlike the front of the ice veins, the surface of the loose layer does not move upwards — it does not follow the daytime one. For it, the conditions for the beginning of ice growth are formed only in that short period when, during soil sedimentation, the constantly increasing thermal resistance of the peat heat shield passes a value close to the "fixed" value indicated above. I.e., when the thermophysical section turns out to be in the state most suitable for retaining the summer zero isotherm on the sole of the STS. The start of formation ice generation prolongs this state. If generation has not started, then in the course of further soil formation, solid peat will begin to move into the upper part of the middle layer — the zero isotherm will end up in peat. With this position of the zero isotherm, the "stabilization mechanism" will not start working. The proposed model of formation ice development is based on a qualitatively outlined thermophysical section of the upper part of the cryolithozone in stable subarctic conditions. It boils down to an understanding of the main features of the described structure of the exposed ice layer, supported, if possible, by elementary thermophysical laws regulating the relationship between the components of the thermophysical section involved in ice formation. The wide prevalence of relief forms of the appearance of ice microvals noted in the study area is considered by us as evidence of the systemic participation of the described lenticular-layered ice in the ALLK massif. 5.2 Development of ALC
The significant role of the ice component in the growth of LC has been noted by many researchers. In particular, the authors of the book "Problems of exogenous relief formation" S. A. Arkhipov et al., considering the formation of accumulative relief on the Yano-Indigirskaya lowland in a territory remote from rivers, state: "Not so much sedimentation as ice formation was the cause of a more or less uniform surface build-up, expressed in accelerated formation of accumulative relief even at low costs of mineral substances" [11, p. 228]. The syngenesis of plant and ice forms on elevated surfaces was pointed out by Yu. K. Vasilchuk: "The active growth of syngenetic re-vein ice occurs subaerally during the accumulation of peat or detached sediments" [5, p. 80]. In permafrost conditions, the subaerial accumulation of sediments with a high proportion of plant residues can be compared with the procedure of the final stage of overgrowth of watershed marshes described by N. I. Piavchenko in his work [12], where, in particular, it is shown that the overgrowth procedure stops when a certain separation of the daytime surface from the aquifer is reached. In the conditions of the cryolithozone, the water-resistant surface rises beyond the daytime. Therefore, the conditions for vegetation growth are preserved. Given in sec. 4 the results of ground-based observations and inspection of workings for economic purposes and available today on the Rosrestravide map from above show that the rock complex coming to the surface is largely a polygonal—vein structure (hereinafter referred to as PZHS) with powerful ice veins. The almost complete absence of a mineral component in the complex is an unambiguous indication that this complex is the result of subaerial cryolithogenesis. During the growth of the identified complex, the accumulated plant soil raises the level of the daytime relief, ensuring the growth of ice veins, and protects ice formations from destruction. The presence of a mineral component, in the above-mentioned fraction of 7%, can be explained by the Aeolian transfer of the material. Let us take note that the rate of subaerial peat-plant soil sedimentation, as revealed by S. N. Prison, is tenths — the first mm/year [13]; in the model of lenticular-layered ice formation described above, it is an order of magnitude lower. In the study area, special attention was paid to the raised areas of non-polygonal hummocky microrelief with a characteristic for them (see section. 4) complete absence of frost-breaking cracking. The wide prevalence of these surfaces and the roughness of the relief associated with them (exits to the alas and dissecting valleys of streams) indicate the significance of their contribution to the collected statistics on the calculated densities of the ALCS. This significant contribution does not form a local variational maximum, fitting with all other calculations into one normal distribution. The absence of obvious statistical deviations (see Fig. 1) guarantees that the density of the rocks covered by the surfaces under consideration is close to the average for ALLC. The option of performing the considered elevated relief forms with solid peat not dissected by ice veins is excluded as unlikely. Formation ice is acceptable, because the ice layer found on the territory of the ALC is located just under a non-polygonal hummocky microrelief, but is not required because one fact cannot generate a rule, especially since it is revealed on a rather extraordinary object. Assuming the presence of subsurface formation ice in the territories under consideration, we will not exclude the possibility of its stretching for hundreds of meters. Moreover, we will designate these territories as the only ones where the presence of large-sized subsurface ice is possible. The rationale for such a presence is given below. The third option is polygonal soil—ice formations. Their presence under the considered microrelief is confirmed by two developments (see section 4). The revealed fact cannot be attributed to random, it organically fits into the understanding that the studied LC as a whole is a PZHS. The presence of a polygonal-vein structure of the ALC under a non-polygonal hummocky microrelief that does not bear traces of frost-breaking cracking makes it possible to distinguish a separate phase of the development of the complex. Consider the selected phase. In Sec. 2, with reference to Yu. B. Badu [3], it is said that the thickness of the vertical veins of LC reaches 8-10 m. in their upper part. According to the results of the study of the LC on the Yanskaya coastal lowland by the section of the Muskhai, scientific editor T. N. Kaplina noted in the comments to the work of E. M. Katasonov: "... in the upper part of the section, ice veins begin to prevail over ground pillars" [14, p. 161]. On the territory of the development of the ALC, a massive opening of ice in the installation recesses was recorded and powerful ice wedges (1 in the cellar and 1 in the catch) with a significant angle of divergence of the lateral faces were found. Summarizing this information, we can come to an important conclusion: during the generation of ice complexes, the proportion of vein ice in the near-surface zone is constantly increasing, respectively, its effective thermal conductivity is constantly increasing. A. I. Popov pointed out the presence of two mechanisms of syngenetic ice formation in the veins of the pancreas: the first is realized on the basis of subvertical frost-breaking cracking, the second is the formation of frontal layers. The first of the mechanisms, when the vein grows, is replaced by the second: "... the change of mechanisms (although incomplete, since vertical cracking still continues) occurs when the width of the ice veins on top is about 0.5-0.7 m" [15, p. 15]. As shown in the work of A. D. Maslov et al. [16, p. 82], the probability of frost-breaking cracking during the autumn freezing increases with an increased temperature gradient of the near-surface frozen thickness: "With large temperature gradients (with a large cooling of the upper horizon of the soil), the adhesion forces may not be sufficient to compensate for the tensile stress. Then the shear deformation occurs, a vertical crack is formed ...".
Taking into account the indicated dependence "large gradient — vertical crack", the absence of frost-breaking cracking observed on the territory of the ALC can be explained as follows. The effective thermal conductivity, which is constantly growing in the near-surface frozen layer of the ALC, leads to a qualitatively significant decrease in the vertical temperature gradient during the autumn cooling periods, which is expressed in the complete cessation of "vertical cracking" and, accordingly, in the complete completion of the change in the mechanisms of vein growth. Possible methods of syngenetic frontal growth of ice veins in conditions of close proximity to the daytime surface are reduced to two options. The first one was proposed by A. I. Popov [15, p. 15-16] and is a process with deformations of the active layer, the opening of diagenetic cavities, the flow of water into the cavity and the formation of conjugation ice. The possibility of such frontal growth for multi-meter veins along the front has been repeatedly questioned. We, additionally considering that there are no traces of activity of the active layer on the surface of the hummocky territories except for the growth of hummocks, we will also consider such frontal growth unlikely. The second option is segregation frontal increments. Its relevance is recognized by many researchers, in particular, according to N. N. Romanovsky [17] (expressed, however, regardless of the question of the exclusive dominance of frontal growth), frontal segregation ice formation is organically inherent in powerful veins. It is appropriate to note that the frontal segregation ice formation, which pushes back the plastic peat STS at this moment, does not lead to its destructive deformation. Stopping, of course, from the two presented options on the second, we get that the exclusively dominant frontal growth of powerful veins in the non-polygonal territories under consideration is provided exclusively by segregational ice formation. The scheme of syngenetic growth of powerful ice veins outlined below is derived for the variant of exclusively dominant frontal growth, taking into account the increased summer heat dissipation capacity of these veins and the low (hundredths – tenths of mm/year) rate of soil sedimentation. The increased summer heat dissipation capacity of ice veins in relation to peat increases both with vertical and horizontal syngenetic growth of the vein. During the purely vertical growth of the vein, it increases due to an increase in the ratio of the growing thermal capacity of the vein to the constant heat exchange area — the frontal surface of the vein. With horizontal growth (expansion) of the core, the ratio of the area of the lateral surfaces of the core to the volume of ice of the core decreases, which leads to a decrease in the specific (per unit volume of ice) heat exchange of powerful cores with the host medium. The result of this "thermophysical independence" of a powerful vein is its stronger freezing in winter and, accordingly, also an increase in its own summer heat dissipation capacity. An increase in the heat dissipation capacity of the core during its regular, following sedimentation growth leads to redundancy of the current thermal resistance covering the core of the STS. This gives the ice the opportunity to grow and consolidate on a position closer to the surface. Let's give an approximate scheme for the implementation of this feature. Based on the data on the thickness of ice lenses given in section 5.1, we will consider continuous subsurface segregational ice releases with a thickness of several millimeters to be normal. The convex growth that occurs over the residential area during the next frontal segregation of ice formation raises the plastic STS by the specified "several millimeters". At the time of subsequent defrosting, the increase is thinned to "fractions of a millimeter" close to the thickness of the layer of soil accumulated over the year. Due to the constantly growing (from year to year) heat-dissipating ability of the vein, a convex "additional increase" fixed by this ability will remain on the ice surface. For this reason, the soil not returned to the horizontal level falls under the action of the mechanism of erosion leveling, which in conditions of slow sedimentation will be especially effective. Erosion of elevated soil reduces the thermal resistance of the STS. As a result of the continuous sequence of the described actions, the resistance of the STS will be maintained exactly the same as it is necessary to protect the ice with the increasing heat dissipation capacity of the core. The schematically outlined procedure for the formation of additional increments occurs in a subarctic climate. In such conditions, additional increments cannot bring ice to the daytime surface: the summer heat-trapping ability of ice veins in the Subarctic is not able to keep the near-surface ice from melting without the help of a protective soil layer. In accordance with this, the period of significant additional gains inevitably gives way to a period of striving for their power to zero: additional gains necessarily degenerate. The ice shaft growing above the vein (hereinafter referred to as the "head of the vein") replaces the excess mass of the STS. The described process of growth of the head of the vein may well leave the daytime surface flat. Just such as it is in the zones of the microrelief in question. Let's pay attention to the fact that with the end of the growth of the head of the vein, regular seasonal frontal ice formation continues, without changing the bending of the front. It follows the accumulation of soil, thereby contributing to the removal of newly formed above the residential soil and the preservation of the established value of the thermal resistance of the STS. The convex summer zero isotherm encircling the head of the vein is a potential start of multidirectional (perpendicular to the isotherm) ice-releasing freezing. It is the presence of a "head" that gives the freezing vectors, one more than the other less, a horizontal component. Syngenetic segregation regular plus, if available, additional increments annually form a new ice cover. The vast majority of this coverage fills the space above the residential area. Only its lowest part expands the vein, increasing according to the ice-releasing freezing vector that has a place in this position. The horizontal increment will be equal to the value of the horizontal component of this vector.
For free-standing veins, horizontal increments go in the direction in which external thermophysical circumstances are unchanged, so external restrictions do not arise. The convergence of veins affects the general thermophysics of the middle layer through the solidarity of influence, mainly making it more favorable for further expansion of veins. Let us turn to the extreme situation when powerful ice veins grow to volumes comparable to the volume of soil blocks, and when the latter may lose their thermophysical independence. During autumn freezing due to horizontal/by lateral heat exchange, they will cool down almost as much as the veins, and in the summer their heating will be prevented by heat removal into the ice. At this stage, the thermophysical conditions on the frontal surface of frozen soil blocks in the ice—contacting zones may change qualitatively - they may become the same or almost the same as those that form on the frontal surface of the ice. Under these conditions, an additional growth mechanism can be connected to the horizontal expansion of the veins, ensuring the exit of the frontal segregation layers beyond the surface of the veins. Let's finish the schematic drawing of the main fairly obvious features of the selected phase of ALC and return to the moment of changing the mechanism of vein growth. It is clear that before him, the development of ALC was in the phase of the formation of PZHS, which took place with the participation of frost cracking. This phase of ALC development is represented by territories of polygonal watered and non-watered microrelief. In relation to the described one, it is preparatory, in the general order of the phases of ALLK — the first. The discovered formation ice is a product of the third phase of ALC development. Let's imagine the entire second phase of the ALC as a process of preparing a thermophysical section for the generation of reservoir ice. At the beginning of the process, we assume that the share of the total area of the frontal surface of the veins is negligible in relation to the total daily surface of their development, the sedimentation rate is hundredths to tenths of mm / year, the rate of frontal ice formation is subordinate to sedimentation and is the same mm / year. We will also assume that the heads of the ice veins have already been formed and, reacting to sedimentation, expand the surfaces of the veins. The thermal resistance of the STS over the veins in the absence of significant additional gains will be constant. For the end of the process, we will take the closure of veins — the start of the formation of subsurface formation ice. The formation being formed is very likely to have a lenticular structure, such as described in Section 5.1, therefore, the rate of frontal ice formation at the time of launch will be estimated by the average power of one lens layer in the microvale. As can be deduced from the description of the stripping (ibid.), this speed is 2-3 mm / year. The climate will be assumed to be constant, so the intensity of the generation of plant soil and its thermophysical qualities will also be constant. In the aspect of sedimentation, the above-mentioned fact of the fixed thermal resistance of the STS over the veins is important because all the soil generated on this STS is subject to demolition to the surrounding area. Process dynamics: · The newly formed soil, raised by segregation ice and redistributed by erosion leveling, turns out to be on the area of soil blocks. Some part of it may be carried away outside the territory under consideration. · With an increase in the frontal area of the veins, the size of the blocks in the plan decreases, respectively, they receive more and more newly formed displaced soil per unit of their area. Their growth is accelerating. · Episodes of frontal ice formation occur against the background of accelerated growth of soil blocks. The lag of the ice surface from the daytime surface will be determined by the "fixed" STS. Consequently, the growth of ice will also be accelerated. · As long as the constancy of the thermal resistance of the STS is maintained due to erosion leveling, there is no soil detachment from its sole. The root cause of the output of ALC generation for the formation of subsurface formation ice will be considered the reason for the expansion of veins — the increased and constantly increasing summer heat dissipation capacity of ice veins during the expansion. The average growth rate of the soil-ice mass in the second phase is significantly higher than its growth rate in the first. Let's make her estimate of the "first approximation". At the beginning of the phase, the growth rate is negligible, at the end of the phase it is 2-3 mm / year. The acceleration of growth in the second phase is assumed to be uniform. Then we get that the average growth rate of the second phase is equal to half the growth rate of the third phase. And this is at a constant intensity of generation of plant soil. The generation of formation ice in the third phase will be taken as it is presented in Section 5.1. Accordingly, if we do not take into account the inclusion of soil veins, the rate of ALC growth in this phase does not depend on the rate of sedimentation.
We will give the following explanation for the preservation of the ice growth rate in the third phase. As we assumed above for the frontal surface of the ice vein located between the soil blocks, a thin residue remains from the volume of ice that is formed during periods of ice—releasing freezing during subsequent defrosting - no more powerful than a layer of newly formed soil. On the surface of solid subsurface formation ice, the entire surface of the middle layer simultaneously rises and is fixed (as the front of a thermophysically consolidated array) at the position reached. There is no adjustment of the defrosting of a new layer of ice increments to the level of neighboring objects. Note the criticality of the increased rate of frontal ice formation. If there were no such speed, then the only way possible for the area of formation ice to maintain the constancy of the thermal resistance of the STS — the detachment of excess soil would lead to the thickening of peat layers in the ice. As a result, the petrophysical boundary on the sole of the STS would be blurred, and further activity of the zero isotherm stabilization mechanism would be impossible. Microvallows can be considered as local formation ice, in which the release of ice formation from dependence on sedimentation occurred before the closure of veins. The formation of local layers in the position noted for them can be linked to the increased freezing of the plateau brows and, accordingly, with the increased temperature component of the summer thermal capacity of the powerful ice veins located on these brows. The microwalls were able to keep intact the layers of ice lenses formed on their surface before the surfaces of the original veins closed. Local layers may have their own methods of expansion inherent in lenticular-layered ice. It is impossible to say for sure whether there are continuous large volumes of subsurface lenticular-layered ice in the territories of the non-polygonal hummocky microrelief of the ALC. But in our opinion, there is an indirect sign of the presence of such volumes, it consists in the following. In the third phase, there is a radical increase in the growth rate of ALC, i.e. the same amount of Aeolian mineral material is distributed over a layer of greater thickness. Segregation ice formation by and large excludes the possibility of the presence of Aeolian material in the ice — it accumulates in peat. The rate of peat formation remains constant, respectively, the concentration of mineral matter accumulated in it remains constant. Peat lenses in the third phase occupy 1-2% of the ice mass (see section 5.1). Accordingly, the aeolian component of the generated mass of ALC decreases by more than an order of magnitude, and the density of this mass, respectively, decreases by ~ 0.1 g/cm3. As an indicator of the presence of large volumes of almost solid ice, a decrease in density can be taken, captured on the density diagram of relief-forming rocks (Fig. 1), where at the interval of elevations of 60-70 meters, the modal density of ALC rocks decreases from ~0.95 to ~0.85 g/cm3. The proportion of "low density rocks" in abnormally light ALC rocks, as can be determined from the diagram, is ~5%. Accordingly, in relation to the area of non-polygonal hummocky microrelief, this will be ~ 15%. According to what is stated in section. 3, petrophysical objects whose characteristics are included in the diagram, due to the wide step of the gravimetric survey, cannot be less than 300 meters horizontally in size. Their power according to the accepted method of petrophysical interpretation of the gravimetric field cannot be less than 5 m. We summarize the information by phases. The first phase goes before the "mechanism change" mentioned above, characterized by frost-breaking cracking of the soil and polygonal microrelief of the daytime surface. The second phase is characterized exclusively by segregational ice formation and evenness of the daytime microrelief. The third phase is: the inherited continuation of exclusively segregational ice formation, the exit of the process of generating the mass of ALCS from subordination to sedimentation and acceleration of this process. The phase change occurs due to the constantly increasing thermophysical influence of the ice component of the middle layer of the cryolithozone on its thermophysics. At the first phase change, this effect manifests itself in a decrease in the vertical temperature gradient and leads to the cessation of frost cracking. At the second phase change, the areas of thermophysical influence of subsurface ice become dominant in the plan, which allows it to switch to its own exclusive way of further development. With the increased heat-dissipation capacity of ice veins increased by local circumstances, the appearance of local formation ice is possible. With the implementation mentioned in Section 5.1, the possibility of the development of lenticular-layered ice from the surface of a loose thickness, it will perform all the power of the ALC. 5.3 Development of cover glaciersAccording to the introduction section. 5, the discovered relief-forming formation ice exists and develops in the following conditions: a flat landscape, a stable subarctic climate with a short climatic summer, the presence of frozen heat-trapping rocks in summer and the presence of peat STS covering the frozen thickness, which has variable seasonally subordinate thermal resistance. The territories corresponding to a given landscape and climatic situation can be very extensive. In the model of formation ice development presented above, there are no internal reasons for stopping growth, and the rate of ice formation practically does not depend on the rate of soil growth. The long-term development of near-surface ice can lead to the development of vast elevated spaces, on which tundra landscapes will prevail. A powerful layer of ice can be considered a glacier.
If the climatic conditions become Arctic (due to altitude gain or climate change), then summer temperatures will stop rising above zero. The stage of subsurface growth of the ice layer will end and the stage of ice formation from snow/firn will begin. During the tightening of climatic conditions, a decrease or disappearance of the STS is inevitable. It will occur due to the exfoliation of excess soil and its fixation in the ice mass in the form of a set of soil lenses or a series of horizontal veins. The fairly obvious build-up of the cryolithozone surface leaves the question of the position of its lower boundary unclear. Consideration of this issue affects the thermophysical situation of the entire upper part of the lithosphere. Let's outline it schematically, taking four simplifying real thermophysics moments: · We will use all the thermophysical characteristics of the area under consideration as long-term average parameters that can only be changed by climate. · We introduce the concept of "thermophysically homogeneous region". By such a region we will understand a territory with constant thermophysical characteristics in terms of area: the temperature of the Earth's surface (TPZ) and the surface density of the heat flux in the upper part of the lithosphere (TPL). In geological terms, this will obviously be the territory of one type of geological structure of the earth's crust. Geographically, it is of the same landscape-climatic type. We will not take into account the possible variations of these thermophysical characteristics of a local nature in the region. · Let's assume that the climate of the region has stable periods during which TPZ and TPL do not change. · The cryolithozone in the region will be considered as a solid geometric body in which the horizontal dimensions are much larger than the vertical ones. We summarize the factors characterizing heat transfer through a cryolithozone in a stable state within the region and: · the heat flow is stationary and homogeneous; · there is a constant temperature, both at the upper and lower boundary of the frozen strata, respectively, the thermal pressure in it is numerically equal to TPZ; · the shape of the cryolithozone is close to the plate. These factors are close to those in the classical problem of intersection by a stationary homogeneous heat flow of a flat homogeneous plate. The parameters of this problem are correlated as follows: R = ?t/q, where R is the thermal resistance of the plate, ?t is the temperature pressure, q is the heat flux density. The constancy (in space and time) of the parameters of the right side of the equation determines the constancy of the left. The shown proximity of the thermophysical scheme of the region to the scheme of the homogeneous plate problem makes it possible to equip the region with an additional characteristic: the constant thermal resistance (R) of its cryolithozone. The constancy of the parameter R in time will be maintained by the reaction of the cryolithozone to changes in the section. For example, the accumulation or demolition of rock that has occurred, which has affected the thermal resistance of the cryolithozone, should be automatically accompanied by an adjustment of the position of its upper and/or lower boundaries. The similarity of the introduced parameter R over the area of the region (not complete due to the accepted simplifications) allows us to use it as a proportionality coefficient between the power and the effective thermal conductivity of the cryolithozone. The closer the petrophysical structure of the place where the coefficient is applied to the horizontally layered medium, the more accurately it corresponds to the task compared with it and the more reliable the calculation result. Let us take as a basis the principle of the constancy of the thermal resistance of the cryolithozone and draw up the following, quite obvious scheme for the development of the cryolithozone in stable climatic conditions conducive to surface ice formation, covering both subarctic and Arctic climates. We use the concept of "irreversible ice growth", which in the model of the development of near-surface formation ice means the appearance of another layer of lenses, and in the Arctic climate the completion of lithification in the chain of snow/firn/ice transitions. 1. An irreversible increase in ice on the surface of the cryolithozone means an increase in its thermal resistance, i.e. a violation of its thermophysical stability. Additional thermal resistance will cause additional heating of the section and, accordingly, a shift of the temperature field upward with thawing of the lower edge of the cryolithozone. The reaction of the cryolithozone, automatically — through defrost restoring the parameter R, is quantitatively determined by the equality of thermal resistances of increase and defrost. It follows from this that the power of the thawing layer is equal to the product of the ice growth power by the ratio of the thermal conductivity of the thawing layer and ice. 2. The constant build-up of ice will cause a constant rise of the lower boundary and a constant (possibly monotonous) change in the capacity of the cryolithozone.
3. The raising of the lower boundary of the cryolithozone will continue until it reaches the bottom of the glacier or until the ice build-up stops. Stopping the build-up will fix the position of the sole of the cryolithozone in the lithosphere. 4. The exit of the lower boundary of the cryolithozone to the bottom of the glacier will determine exclusively the icy composition of the cryolithozone and, accordingly, the impossibility of raising the zero isotherm higher. 5. From this moment on, the constancy of the thermal resistance of the cryolithozone, growing with surface ice, is maintained by the melting of the glacier base. Instead of raising the lower boundary of the cryolithozone, the glacier is shrinking. The progressive development of the cryolithozone ends with its complete withdrawal from the lithosphere and the beginning of a closed cycle of generation / destruction. During the shrinkage of the glacier, if there is STS soil in it, its release and entrainment by melt water is possible. The end of the glacier growth that we have deduced corresponds to the achievement of its "maximum capacity". This independent concept was introduced by I. A. Zotikov in his physical and mathematical modeling of the thermal regime of the glacier [18]. As one of the essential signs indicating that the glacier has reached its maximum capacity, the presence of a thawed medium was assumed, directly under the sole of the glacier. Subsequently, I. A. Zotikov's hypothesis was confirmed, in particular, by the discovery of subglacial lakes. The output of the proposed scheme of cryolithozone development to a phenomenon long known in geocryology emphasizes the consistency of this scheme and indicates the expediency of including in the conceptual system of geocryology the principle of constancy of the thermal resistance of the cryolithozone within a thermophysically homogeneous region. The growth of the glacier means a change in the landscape and, very likely, a change in the regional climate, that is, the cryolithozone, changing external conditions, can have its own impact on the TPZ. As a result, a new, greater thermal resistance of the cryolithozone may be established for the region, which will cause an increase in the maximum possible capacity of the glacier. Let's return to the question of the position of the lower surface of the cryolithozone: · Climate changes are possible, which do not lead to an increase in TPZ, but contribute to the "irreversible melting of ice". This is, for example, the cessation of snow precipitation with a constant level of solar radiation. If the cryolithozone remains stable with these changes, then the support of the parameter R remains: the sole of the cryolithozone will begin to sink into the lithosphere. There will be no stability support for the parameter R in the degrading cryolithozone. · The leakage of glacier ice from the accumulation zone reduces the capacity of the glacier. If the rate of this decrease is comparable to the rate of ice accumulation, then the maximum power may not be reached. This dynamic equilibrium is the same stop of glacier growth, which is noted in paragraph 3 of the "development scheme", with necessarily accompanying fixation of the position of the sole of the cryolithozone in the lithosphere. At the time of melting of the glacier, there may be an active or buried STS inside it. Such STS in a more or less preserved form will appear on the surface of the Earth, with all their tundra botany. The proposed approach to the theory of the development of cover glaciers may be useful in forming alternative views on some issues of glaciology. 6 ConclusionStatistical processing of the results of the petrophysical interpretation of gravimetric observations made it possible to identify an abnormally light massif separated from the underlying rocks by a clearly defined horizontal density boundary. This array is defined as an abnormally light ice complex (ALC) of peat-ice execution. On the territory of the ALC, one production discovered a formation of lenticular-layered ice, which, taking into account related factors, was determined as an instance of one of the systemic components of the ALC. Gravimetric data, the features of the landscape of the territory and the revealed details of the structure of the ALC are interconnected and constitute the first — the maximum currently possible idea of the complex. The main elements of the presentation are the three phases of the complex, reflecting the dynamics of its development as a whole. The first is classical, generally accepted for polygonal—vein structures, with the participation of frost-breaking cracking, the second is based on classical, but without frost—breaking cracking, the third is the generation of subsurface formation lenticular—layered ice. As the main factor determining the change of phases, the constantly increasing thermophysical influence of the ice component of the middle layer of the cryolithozone on its thermophysics is put forward, which first leads to the cessation of frost-breaking cracking, and then to the release of ice formation from subordination to sedimentation. Conceptual models of peat-ice mass generation within the framework of the second and third phases are compiled, the development of the third phase is extrapolated to the scale of the cover glacier. These models are based on the qualitative difference of the components of the cryolithozone of the territory in terms of thermophysical characteristics. The differences of the components taken into account made it possible to introduce and to some extent develop several concepts necessary for the modeling. These are: the heat-trapping ability of the middle layer, the principle of stabilization of the zero isotherm at the petrophysical boundary; the long-term constancy of the resistance of the STS taken during its maximum defrost; stable ice formation zones in the lenticular-layered ice array; conditions for the beginning of the growth of lenticular-layered ice; a special thermophysical regime of the polygonal-vein structure under a non-polygonal microrelief; the principle of lateral segregation growth of powerful ice veins; the principle of constancy of thermal resistance of the cryolithozone. The novelty of the study consists of:
· in identifying a unique petrophysical object, · in defining this object as an ALLC of peat-ice execution, · in identifying an array of lenticular-layered ice on the territory of the ALC and in determining it as an instance of one of the systemic components of the ALC, · in the representation of the development of the complex as a sequence of three successive phases, · in the compilation of conceptual models of the second and third phases of the ALC, based on the qualitative differences of thermophysically isolated components of the cryolithozone, · in the original approach to the theory of the development of the cover glaciers, based on the extrapolation of the third phase of the ALC. The information presented in the article relates to three levels: · primary information (observed or calculated) on ALLK, · conceptual understanding of the nature of ALCS, · developments in the field of thermal physics of the cryolithozone of the region. All of this information can be used in the future when setting tasks for subsequent ALC research.
References
1. Petrov A. N., Soloviev N. M., Timoshenko N. I. (1986). Report on the results of outpace geophysical works within the Churpunya-Maksunuoha zone of magnetic anomalies in 1982-85. 438 p. Moscow: FSBI «Rosgeolfond», CS, № 429931. (in Russian).
2. Rosreestr. The Federal Service for State Registrations, Cadastre and Cartography. Public Cadastral Map. [Image (cartographic ; stationary ; two-dimensional) : electronic]. URL: https://pkk.rosreestr.ru (date of application: 25.12.2021).
3. Badu Yu. B. (2010). Cryolithology. Moscow: KDU. 528 p. ISBN: 978-5-98227-732-9 (in Russian).
4. Solomatin V. I. (2013). Physics and geography of underground glaciation. Novosibirsk, Russia: Geo. 346 p. ISBN: 978-5-9062284-35-8 (in Russian).
5. Vasil'chuk Yu. K. (2006). Ice Wedge: Heterocyclity, Heterogeneity, Heterochroneity. Moscow: Moscow University Press. 392 p. ISBN: 5-211-05212-9 (in Russian).
6. Shmelev D. G. (2015). Role of cryogenese in the formation of composition of the Late Quaternary deposits in Antarctic oasis and North East Yakutia. Earth's Cryosphere. 19(1), pp. 41–57. ISSN: 1560-7496 (in Russian).
7. Semenov S. M. (Ed.), Anisimov O. A., Borshh S. V., Georgievskij V. Yu. et al. (2012). Methods for assessing climate change effects for physical and biological systems. Moscow: Planeta. 511 p. ISBN: 978-5-904206-10-9 (in Russian).
8. Ershov E. D. (Ed.), Zhestkova T. N., Kuchukov E. Z. et al. (1996). Fundamentals of Geocryology. Part 2. Lithogenetic Geocryology. Moscow: Moscow University Press. 399 p. ISBN: 5-211-03533-X (in Russian).
9. Boitsov A. V. (2011). Geocryology and the Ground Waters of the Permafrost Zone. Tyumen, Russia: Tyumen University Press. 177 p. ISBN: 978-5-9961-0400-0 (in Russian).
10. Davydov S. P., Davydova A. I., Fedorov-Davydov D. G. et al. (2012). Temperature Regime of Permafrost Affected Soils in Northern Yakutia. In K. M. Hinkel & V. P. Melnikov (Eds.), Proceedings of the Tenth International Conference on Permafrost: Resources and Risks of Permafrost Areas in a Changing World, 4/1, pp. 105–106. Tyumen, Russia: Pechatnik. ISBN: 978-5-9961-0510-6 (in Russian).
11. Arkhipov S. A., Ivanovskiy L. N., Isaeva L. L. et al. (1976). Problems of exogenous relief formation: The glacial, cryogenic, aeolian, karst and sea coasts relief. Book 1. Moscow: Nauka. 428 p. (in Russian).
12. Piavchenko N. I. (1985). Peat bogs, their natural and economic significance. Moscow: Nauka. 152 p. (in Russian).
13. Tyuremnov S. N. (1976). Accumulation and transformation of the initial plant biomass into peat. Peatlands. Moscow: Nedra. 488 p. (in Russian).
14. Kaplina T. N. (Ed.), Katasonov E. M. (2009). Lithology of frozen quaternary deposits (Cryolithology) of the Yana Coastal Plain. Moscow: PNIIIS. 176 p. (in Russian).
15. Popov A. I. (1965). Ground Ice. Ground Ice (Moscow State University), 1, pp. 7–39. (in Russian).
16. Maslov A. D., Osadchaya G. G., Tumelʹ N. V., Shpolyanskaya N. A. (2005). Fundamentals of geocryology. Ukhta, Russia: Institute of Management, Information and Business. 176 p. ISBN: 5-9641-0011-2 (in Russian).
17. Romanovsky N. N. (1977). Formation of the polygonal vein structures. Novosibirsk, Russia: Nauka. 212 p. (in Russian).
18. Zotikov I. A. (1962). Heat regime of central Antarctica Ice Sheet. Antarctic, Reports of the Commission for 1961, 23, pp. 27–40. (in Russian).
| 


